Speed is very important for a website. It’s so important that Google has made it an actual ranking factor. Over time, Google has taken action to improve the loading speed of websites by providing a set of tools for developers and webmasters. One of these tools is Google Lighthouse.
But how does this PageSpeed Insights Tool from Google actually work? And, more importantly, does page speed affect SEO? You’ll find everything you need to know in this article.

The PageSpeed Insights Tool didn’t use to be very good in the past. Most of the information there could be found relatively easy elsewhere and it didn’t quite indicate speed itself. However, Google has recently updated the tool and it’s a lot better. Unfortunately, it’s also a lot harder to understand.
However, this tool has became popular among SEOs through PageSpeed Insights, which is, in fact, powered by Lighthouse, but provides the information in an easy to follow format, on a web page.
- What Is Google PageSpeed Insights?
- Mobile vs. Desktop
- What is page speed actually?
- Does PageSpeed Insights Affect SEO? Is 100/100 Score Essential?
- PageSpeed Insights Metrics
- Field & Lab Data (Performance Metrics)
- Opportunities & Diagnostics
- How Is the PageSpeed Insights Score Calculated?
- Key Points in Improving the PageSpeed Insights Score
- Server response time
- Image compression
- HTML & CSS Structure
- Minification & Script Compression
- Cache Policy
- Lightweight Theme & Plugins
- How to Bulk Check the PageSpeed Insights Score
- Other Tools for Measuring & Improving Site Speed
- Pingdom
- GT-Metrix
- mod_pagespeed
- Google AMP (Accelerated Mobile Pages)
What Is Google PageSpeed Insights?
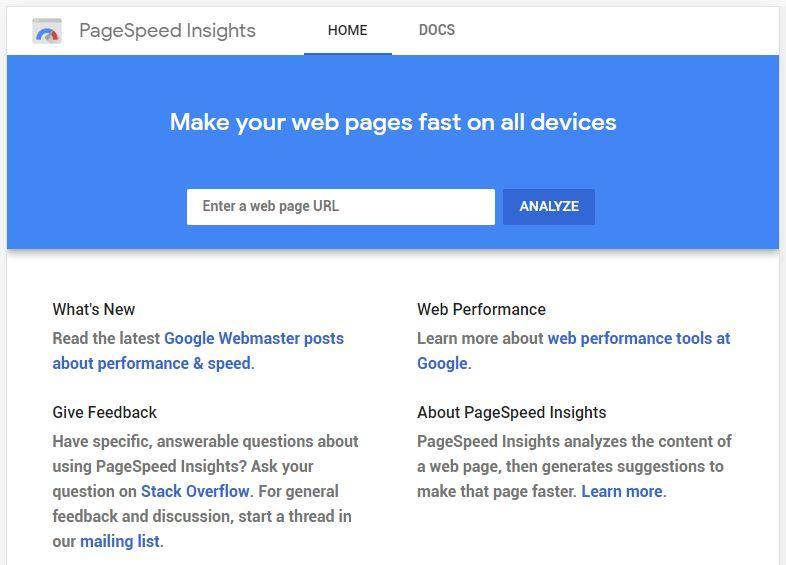
PageSpeed Insights is an online tool provided by Google which is used to identify web performance issues on sites. Although mostly related to technical SEO issues, the tools also analyze the site from a User Experience and accessibility point of view.
You can access PageSpeed Insights by visiting https://developers.google.com/speed/pagespeed/insights/.

You can enter the URL there and after a few seconds the tool will return a page with some results regarding your website’s performance. At the top, there will be a general score, which is an average of multiple factors. Below you will see detailed information about what actually affects your speed.
However, it isn’t the only PageSpeed tool provided by Google. There also is mod_pagespeed, a server module used to solve these speed issues, and the full fledged Lighthouse (the site analysis tool that powers everything), available in Chrome itself. There are also a number of Chrome Extensions related to Google’s PageSpeed Insights.
We will discuss briefly about all of them throughout this article, but we will focus mainly on PageSpeed Insights as it seems to be the handiest tool most SEOs use when checking a website.
Mobile vs. Desktop
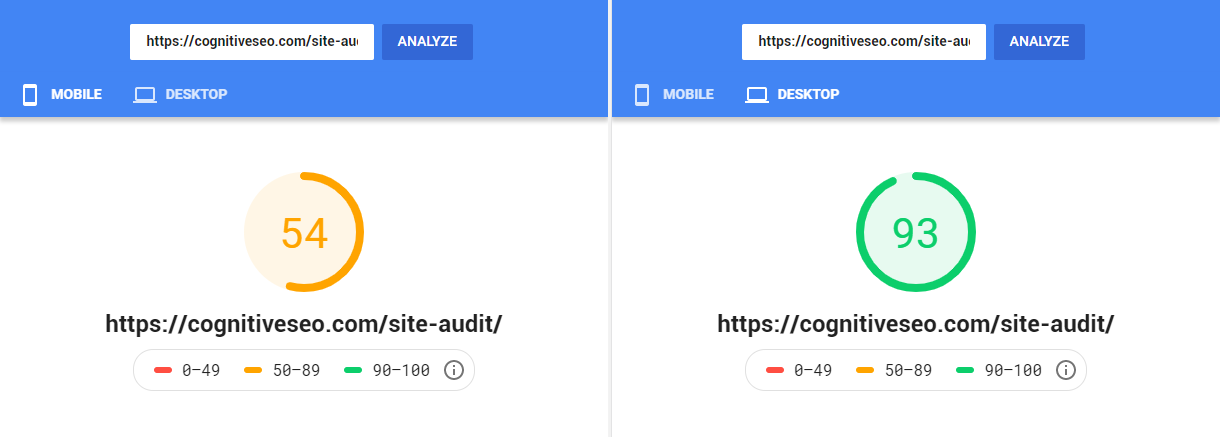
When you insert a page to test it, Google will give two scores: one for the mobile version and one for the desktop version.
Initially, the PageSpeed Tool only gave one score, for the Desktop version. But recently, mobile usage has became more and more popular. As of 2018, more than 50% of search engine users search on mobile devices. As Google moved to a mobile first index, it also made sense for them to test mobile versions for speed first.

However, if you have a responsive design, you might think that these versions are mostly identical.
If so, why do they have different scores?
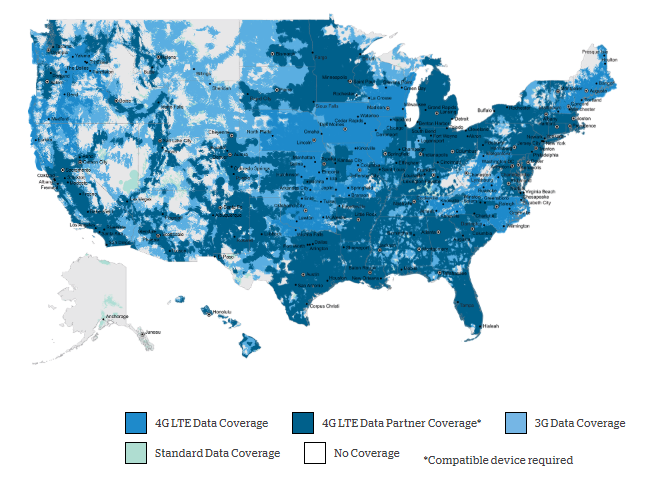
Mobile: When you use the PageSpeed Insights tool, the first result you’ll get is for mobile speed. This means that your website has been tested on a mobile connection, probably with a 4G connection, as it seems to be the most common speed around the US at least.

https://www.uscellular.com/coverage-map/voice-and-data-maps.html
However, keep in mind that many mobile users around the world still get only 3G signal and, although they have a slower connection speed, they still expect the website to load really fast.
And here’s the problem. It’s not always about your site, it’s more about the connection’s speed. It might seem like your site is slow when, in reality, the connection speed is slow.
Desktop: On desktop, the score is higher because the connection speed is higher. That’s just the thing with light and fiber optics. Unless you live in the UK, of course, and still have cups and string internet.
So the website goes through the same testing, but it’s mostly the connection speed that differs.
That’s why mobile comes first, as mobile devices usually have slower connections. Things might change with 5G but, until then, make sure you focus on improving your site speed for mobile devices.
What exactly is Page Speed?
OK, so we know what the tool does: it gives a score based on how fast it thinks your site is. But what exactly is page speed?
Page Speed is the speed at which an individual page loads on your website. Different pages can have different speeds due to factors such as images and scripts.
But speed is relative. It depends on so many factors such as the website’s performance, the server’s performance, the particular web page you’re on, the connection type, the user’s internet service provider, the internet package, the device’s processing power, the Browser, what the user is doing at that point, how many apps are running and so on.
However, we can only work with what we can work, which is our website and our server. We don’t really have control over the rest.
Just to get things straight, page speed isn’t a score, like PageSpeed Insights presents. It’s a web page’s loading time and it is measured in seconds. That’s what matters.
That’s why Google PageSpeed Insights wasn’t so good in the past. It didn’t quite give you information about how fast your website is actually loading. Just scores.
And that’s why this new version is just so good. It tells you everything you need to know about actual loading speed while also keeping the good stuff from the old version.
There are, of course, different points of interest in the loading time. For example, you may want to run some scripts towards the end because they don’t need to be used initially.
They might take a lot to finish loading, so the total loading time could be higher. But if the site is usable until then, it isn’t such a big problem.

For example, let’s say you want to run an exit intent pop-up script. That script takes a hypothetical 5-10 seconds to load. However, you want to show it to the user only after about 20-30 seconds.
If you start running your script immediately, you might postpone loading other important elements, such as the first thing the user should see: the above the fold content. This would be very bad, especially since you’re not going to use that script until about 20-30 seconds in the future.
So you can postpone loading the script after everything else that is vital loads in order to give the user a better experience.
However, if you have a script that makes the menu work or something vital to the usability of the website, you might not want to load it towards the end. This would ruin the experience as the user would not be able to access that function before everything else is loaded.
Does Page Speed Affect SEO? Is 100/100 Insights Score Essential?
The simple answer is that page speed does affect SEO. Page speed is a direct ranking factor, a fact known even better since Google’s Algorithm Speed Update. However, speed can also affect rankings indirectly, by increasing the bounce rate and reducing dwell time.
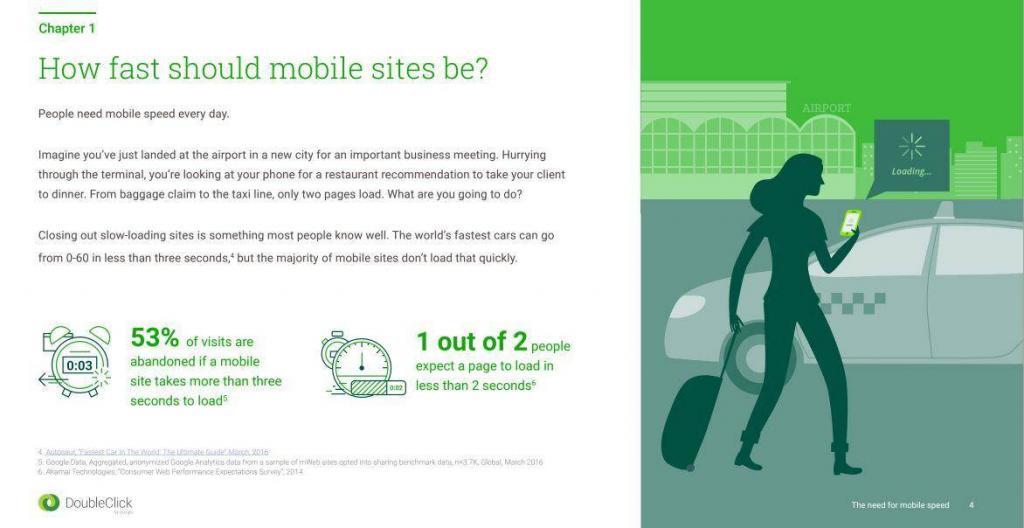
At Google, users come first. Studies by Google show that average 3G loading speed is very slow. They also show that users leave the site after about 3 seconds. This means that their experience is bad and Google doesn’t like ranking sites which provide bad user experience.

What you must remember is that speed is measured in seconds, not in points from 0 to 100. While PageSpeed Insights is a tool that helps you improve speed, the score there doesn’t necessarily mean anything in the real world.
Even so, it is important to improve the Page Speed Score.
Why?
Because with Google we don’t know for sure whether the score there is or is not used as a ranking factor. Does Google use seconds? Does it use the score? Who knows…
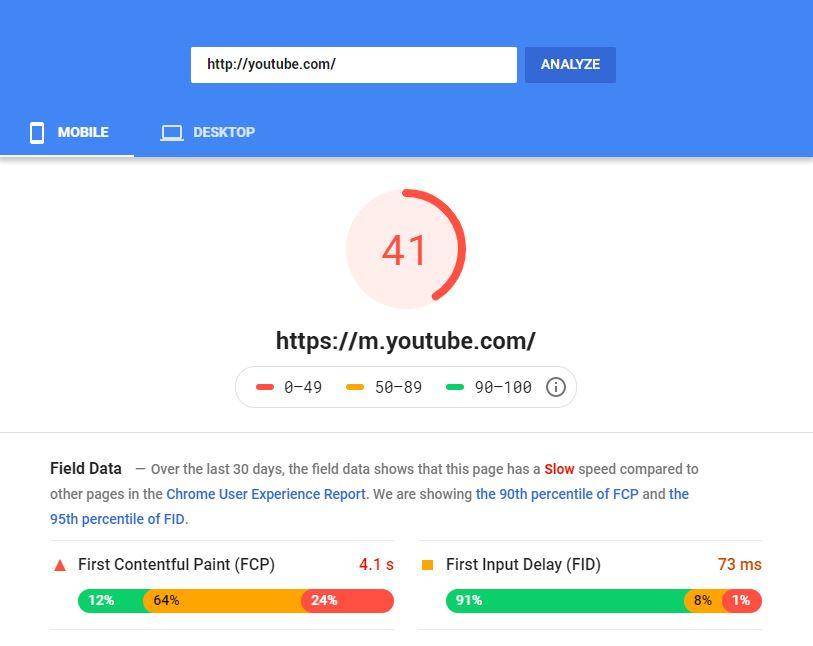
However, I’ve seen sites with perfect pagespeed score ranking poorly and websites with a score lower than 50 that rank very well (#youtube).
However, you have to take into account how Google makes these tests. We don’t know where the tests are performed from. Is your server from Romania and Google tests it with a 3G connection in the US? Well then, you can obviously expect low speeds.
But just for the user’s sake, put the loading time first. And don’t use only PageSpeed Insights to test that. Stick to the end and I’ll show you a couple of tools which you can use to test the speed at which your website loads from different locations.
Sometimes, Google contradicts itself!
For example, Google PageSpeed Insights considers the Google Analytics script render blocking, which means you should load it later, in the footer. However, Google Analytics specifies it pretty clearly that the script must be placed in the <head> section of your website, otherwise it won’t work properly and won’t initially be accepted as a valid install.
So you get a small score hit in PageSpeed Insights… by doing what Google says… just to be told that you shouldn’t do it like that… by Google. You get the point.
Also, you can’t cache the script properly unless you store the analytics.js file on your server. That’s obviously something Google Analytics doesn’t recommend. It’s also a hell for maintenance, as every time Google Analytics JavaScript file gets an update, you would have to update it on your site as well.
This, of course, doesn’t happen only with Google tools and scripts but with any 3rd party script you don’t have control over.
In our defense, even YouTube, which is owned by Google and should theoretically set an example, has a pretty slow PageSpeed Insights score, at least at the time of writing this article.

But that doesn’t mean that the site loads slow. You can see that the field data (for which there is plenty of, as it’s YouTube) says the site loads in pretty much 4 seconds, which isn’t actually bad, considering that recently YouTube provides video previews in the thumbnails.
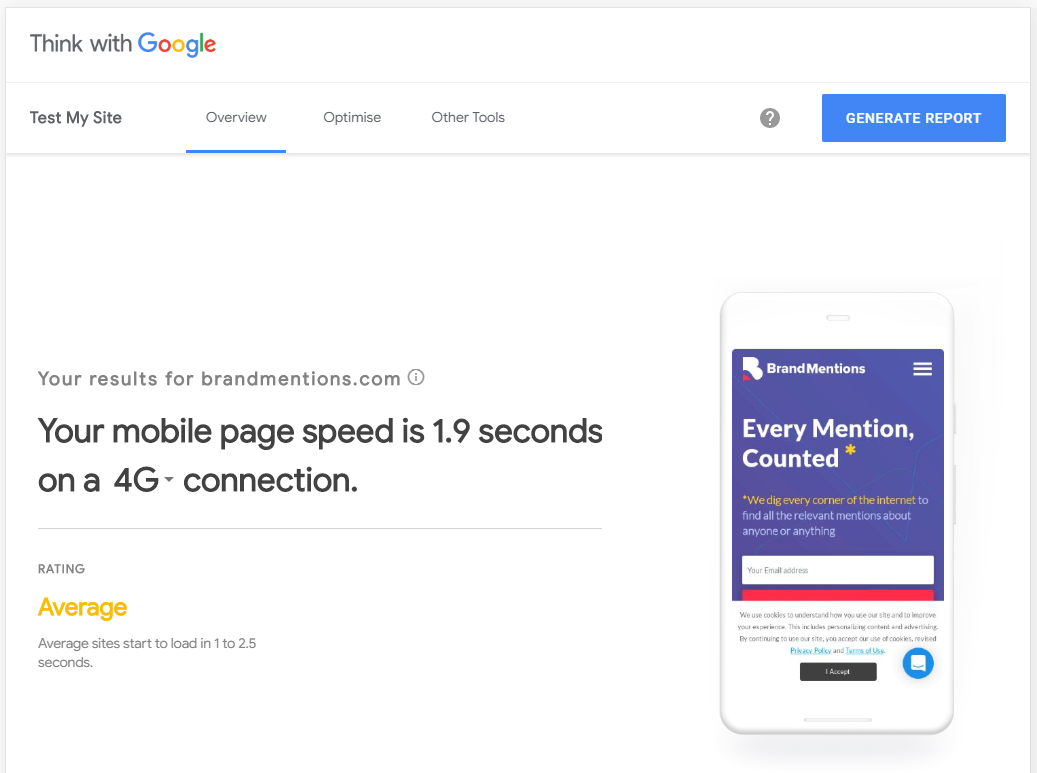
You can also test your site with https://www.thinkwithgoogle.com/intl/en-gb/feature/testmysite/ to get a more simple explanation of how fast your site loads!

Our other business’s website, BrandMentions loads in under 2 seconds on a 4G connection, as you can see above. We would see it as pretty good. Sure, there’s always room for improvement. By Google standards… it’s average.
However, Google seems to consider cognitiveSEO’s website speed slow, even though it loads in a little over 3 seconds, which is still pretty fast considering the amount of 3rd party tools we’re using.

Note that you’ll have to go under 1 second to be considered fast! To do so, you’ll probably need a very simple site with no 3rd party plugins or fancy pop-ups. Not easy if you actually want to do some digital marketing.
So yes, loading speed is important for SEO, but a perfect PageSpeed Insights score is not. As long as your website loads in around 3 seconds, you should be fine with most users.
PageSpeed Insights Metrics
Since so many things can affect site speed, Google breaks everything up in different categories in the PageSpeed Insights Tool, for a better understanding of the issues.
This is helpful as Google also provides some sort of prioritization, showing you what exactly affects speed the most.
Field & Lab Data
These are the new metrics that are actually useful. They are split into two categories: field and lab data.
Field data is what’s important in the real world, as it’s the data extracted by Google from real users, either through Chrome or other data providers.
Sure, it’s an average and if Google doesn’t yet have enough data it will let you know.
Origin Summary shows an average of the site’s speed as a whole. This way you can have an idea on how your page compares to the site and how the site compares to other sites in the Chrome User Experience Report.
Lab data, although still useful, could be considered less important as it is collected from a controlled environment. This means that it’s tested through a single connection and it doesn’t aggregate data from multiple users.
The lab data is what actually generates the Google page speed score.
Due to the fact that Google doesn’t always have field data, it uses the lab data which is performed on the spot to analyze your site.
First Contentful Paint represents the moment when the users sees something on your web page for the first time. If you look at the series of images you can actually spot how it looks:

As you can see, the page has not fully rendered, something has displayed there.
First Meaningful Paint is the second step, let’s say, if we take the results above as an example. It represents the point at which the user can actually understand the first piece of content. For example, some readable text or an image displays, instead of just colors and backgrounds.
Speed Index is a more complex metric. It measures how quickly elements on your website are visibly populated. The faster they start to appear, the better. You’re looking for a lower score here, as it’s also measured in seconds.
First CPU Idle represents the point at which the site has loaded enough of the information for it to be able to handle a user’s first input. For example, if the site has not loaded enough relevant information, the user might tap elements or scroll down but nothing will happen.
Time to Interactive is the next level, the one at which the website is fully interactive. This means that everything has loaded in the device’s memory and is now ready to be used.
Max Potential First Input Delay is the delay a user experiences from the point at which they interact with the browsers to the point at which the browser responds. This is the only performance metric which doesn’t affect the page speed score.
Opportunities & Diagnostics
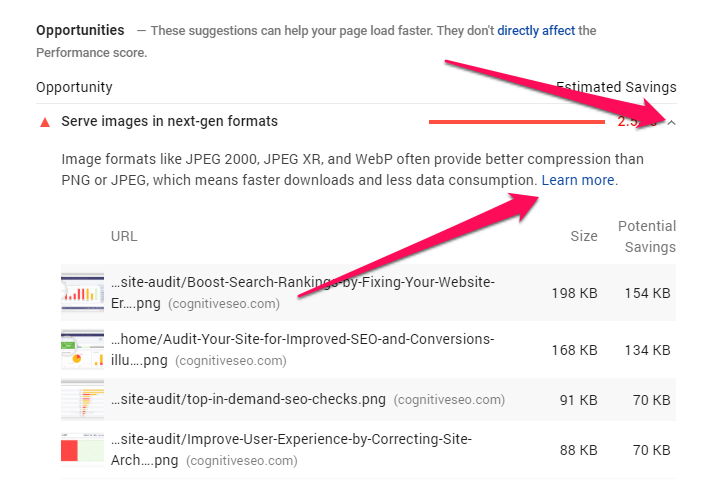
The opportunities section provides information on what you can improve on your site. It also tells you an estimate of how much each issue affects your load time and how you should prioritize your tasks.
Going through each and everyone of them would be overkill. However, under each metric you’ll have a small arrow which you can use to expand the section.

There you will find information about each and every recommendation and how to fix the issue to improve your site’s speed. You will notice that the elements which cause the biggest issues are, in general, images and 3rd party scripts.
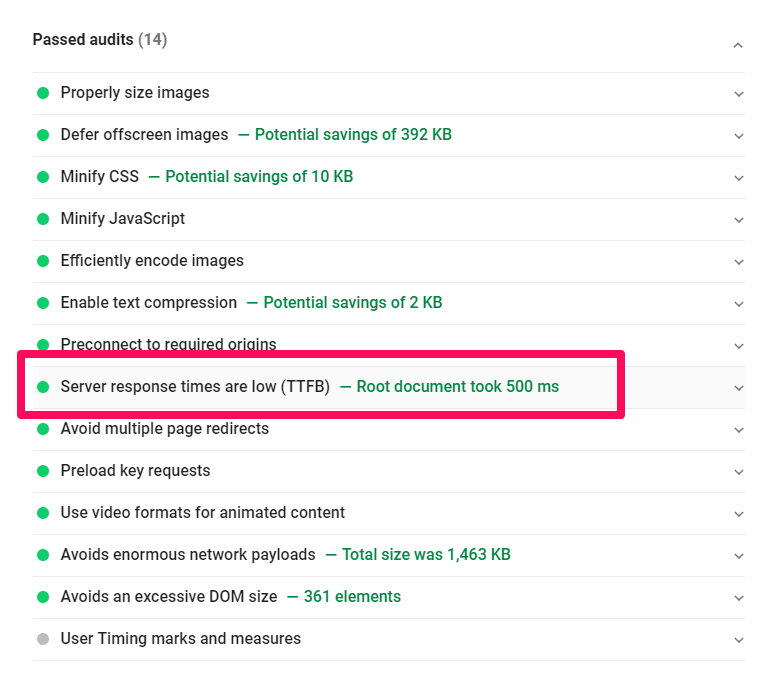
The Passed Audits section is the list of things that you already do well on your web page. Basically, it will show elements from both the Opportunities and Diagnostics sections that fit within Google’s parameters.
The more you have in this list, the better!
How Is the PageSpeed Insights Score Calculated?
Although you might see so many things in the PageSpeed Insights Tool, the score is actually calculated using only the seconds in the Lab Data section. If you read closely, you’ll actually be able to see the message “These metrics don’t directly affect the Performance score.” under Opportunities & Diagnostics.
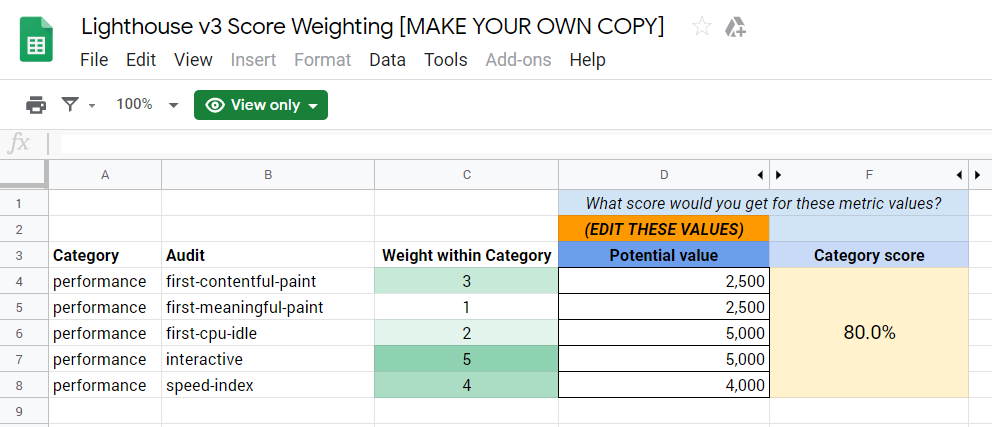
The metrics in the Lab Data are called performance metrics. There are 6 of them and we’ve presented them above. Each metric gets a score from 0 to 100. Each metric has a different weight in calculating the score.
3 – First contentful paint
1 – First meaningful paint
2 – First cpu idle
5 – Time to interactive
4 – Speed index
0 – Estimated input latency
By order of importance, they are listed as such: Time to Interactive, Speed Index, First Contentful Paint, First CPU Idle, First Meaningful Paint and Estimated Input Latency, which actually has no effect on the score.
The scores are based on Log-normal distribution algorithms so let’s not get too deep down the rabbit hole. If you want to learn more you can read this page.
Google has also put a Sheet file which you can use to see how the score is actually generated. If you know Excel functions, you can reverse engineer how everything works. You can download this file here, but you have to make your own copy (File -> Make your own copy) before you can edit it. There’s also a version for Lighthouse v5.

To put it in simple terms, the First Contentful Paint impacts the score more than the First Meaningful Paint, and so on.
Why? Well, probably because if nothing displays on the screen, the user is more likely to leave your website. If you display… something, you’ll win some time to get the rest of the thing delivered.
The scores are ultimately divided into 3 categories, Slow (0-49), Average (50-89) and Good (90-100). Then an average is generated as a final score for your website.
Generally, if you’re under 50, you do have some issues that need fixing! But again, don’t sweat it if your site loads in about 3 seconds.
Key Points in Improving the PageSpeed Insights Score
Everything up there might be a little big hard to digest. We get it. Most probably, you won’t be able to solve everything! We’ve ruled out that it’s not important to get a 100% score. However, here are the key elements that will noticeably make your site load faster.
Warning: perform a backup of both your files and your database before engaging in these improvements. They can mess up your website and you have to make sure you can return to a previous version!
Server response time
The server is something you can’t really improve yourself. You either have a good one or a bad one. To improve it, you would either have to reduce load on it significantly, or improve its hardware, both of which you don’t have control over, unless you own the physical machine.
So it’s important to have a good server in the first place. But how do you choose a good server?
Well, any hosting company that ranks well on Google should provide decent services. However, it’s up to you to test. Best advice? If you’re mostly focused on local SEO, choose a local server. For example, if most of your audience lives in Italy, choose a server with the datacenter in Italy.
If the datacenter is all the way in the US, the information will have to travel a big distance before reaching your target audience.
You can always test the hosting provider’s own website with PageSpeed Insights and look for their TTFB (Time To First Byte) or Server Response Time. If it’s in the Passed Audits section, you know you have yourself a good hosting provider.

However, it’s better if you know someone that is an actual client of the hosting provider so you can test the speed there.
Realistically, the host’s own website will probably be on a dedicated server, while your site will be on a shared hosting package. This means that you will share the computer’s CPU and internet bandwidth with other websites.
If you can test a real site from a client, that’s great. You might be able to look through the reviews and find clients or ask the support team to provide one.
Image compression
In general, images are the biggest problem with websites. They are big and take up a lot to download.
There are two types of issues with the images. The first one is the screen size vs. the actual image size in pixels and the second one is the disk size.
Disk Size: The more physical space an image takes on a hard disk or SSD, the more it will take to download. 100 KB will download a lot faster than 1000 KB (1MB). If you have 10 images like that on your blog post, expect your site to load very slow.
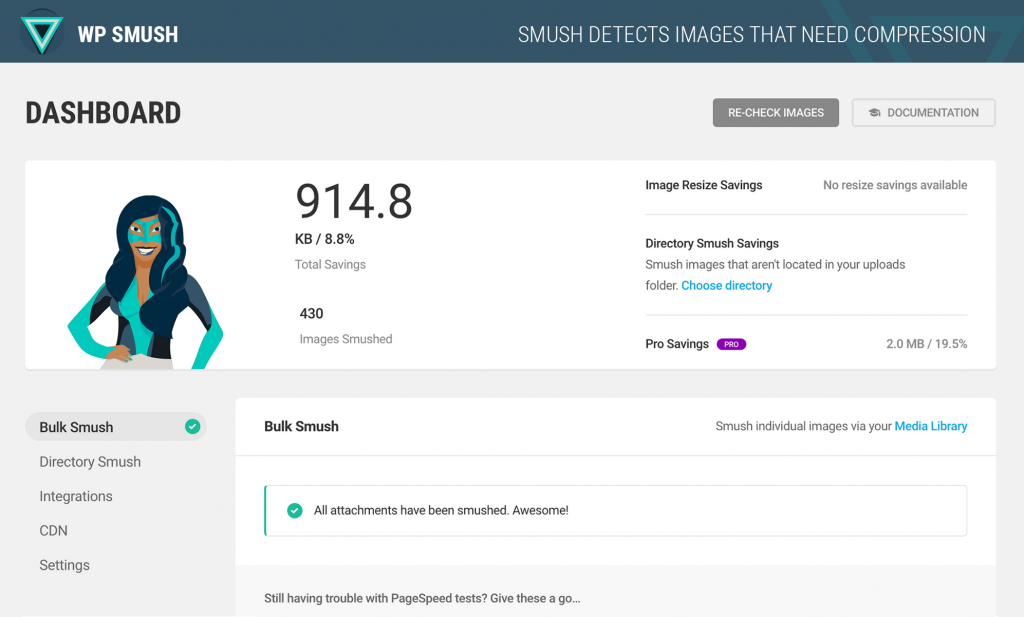
You can use WP Smush to optimize your images. It’s a plugin that will compress the images without losing any quality. This means that you can shrink a 1000×1000 pixels image from 200 KB to 150 KB without noticing the difference in quality, therefore making it load 25% faster.

Screen Size: Screen size is the size at which an image is displayed. For example, the image below is being displayed at 300×300 pixels.

To make images load faster, you first have to make sure you’re not using an image bigger than it’s going to be displayed. For example, if you have an HTML section that styled with CSS at 300×300 pixels, but you load an 1000×1000 pixels image in the source, you’re losing load time for that 700×700 pixels.
That’s because the Browser has to download the 1000×1000 pixels image and then shrink it to 300×300 pixels. This takes more time for both the download and the shrinking process. You can fix this by uploading your images with the same width and height that they will be displayed at.
WordPress does this automatically by creating multiple instances of the image when you upload it. That’s why you’ll see that 300×300 or 150×150 suffix at the end of an image file path. That’s why you can choose sizes (Large, Medium, Thumbnail). Although it’s not perfect, especially if you manually resize the image with click and drag, and it takes up more space on your server on the long run, it does help with load speed.
Deferring the images is another thing that you can do to improve the load time. This means that you can download them later as the user scrolls down on the web page. There will be a brief moment when the images won’t be visible but they will eventually show up, one after another.
This helps the Browsers focus on the important part, the one which the users is viewing at that point.

There are a multitude of plugins that can help you do that. However, many have bugs or only defer images in certain situations, for example if they are created by WordPress or WooCommerce, but not when created or inserted by less popular plugins.
There are certainly plugins for other CMS, such as Joomla or Magento. Just perform a Google search for them. If you’re not on a popular CMS, such as WordPress, deferring images can be done with jQuery, but you’ll most certainly need a developer for it, if you’re not one yourself.
Next gen image formats are recommended by Google. They are very useful, especially when loading a website from a mobile device. However, there’s a reason not many people use them yet.
Next gen image formats are not yet supported by all major browsers. This means that you’ll need to dynamically serve different formats for different browsers.
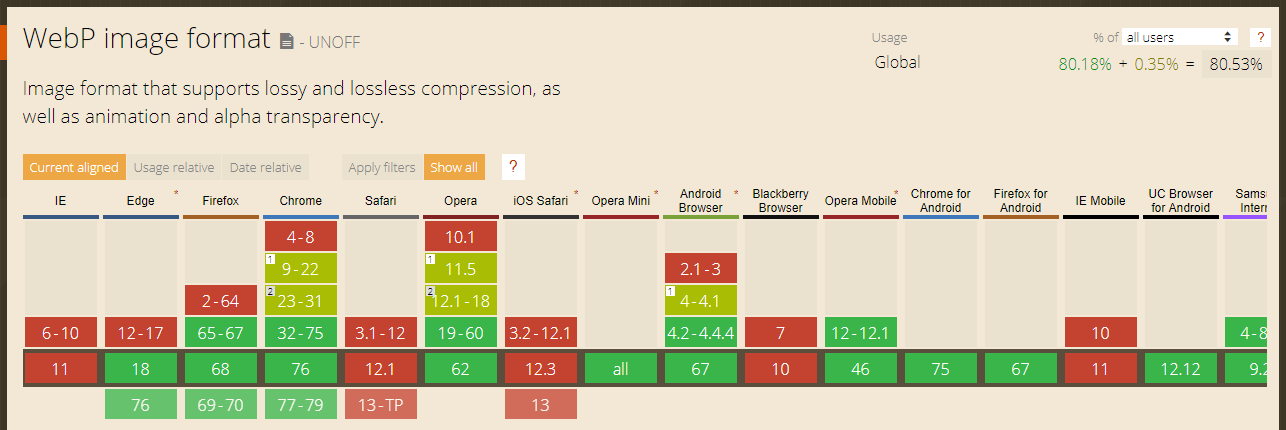
If you can use a plugin on your CMS that might be easy, but if you’re on a custom platform, you’ll need to develop everything from scratch, which costs a lot. Here’s a list of which browsers support the WebP format.

If you size and optimize your images properly, the savings you’ll get by also converting them to next gen image formats such as JPEG2000 or WebP might not be worth the cost in time and money.
However, if you have the time and budget, by all means, go do it. You can use this tool to check if the browsers your users spend most time on are supported. Search for either WebP or JPEG2000.
HTML & CSS Structure
The HTML structure of your web page dictates the way it loads. Browsers read a page from the top to the bottom and they load the elements the same way. This means that if you want something to load first, you have to put it higher in your page.
Generally, the issues are not with HTML but with CSS. If you write your CSS chaotically, it will result in a slower loading time and a bad user experience.
Let’s take an example. Most websites, if not all, follow this HTML structure: head > body > footer.
If my CSS file styles the footer first, then the footer will receive the styling, although it is before the fold. Meanwhile, the header and body might remain plain.
It’s also a good idea to add your mobile styling first, as mobile devices are the slowest ones.
The same goes with renderblocking JavaScript. Postpone scripts that are not vital. Add them to the footer so that they will be loaded last.
However, if you have important scripts such as Analytics which should run as soon as possible, then by all means keep them in the header and make sure they fire and run properly, even though this might result in a lower PageSpeed score.
Minification & Script Compression
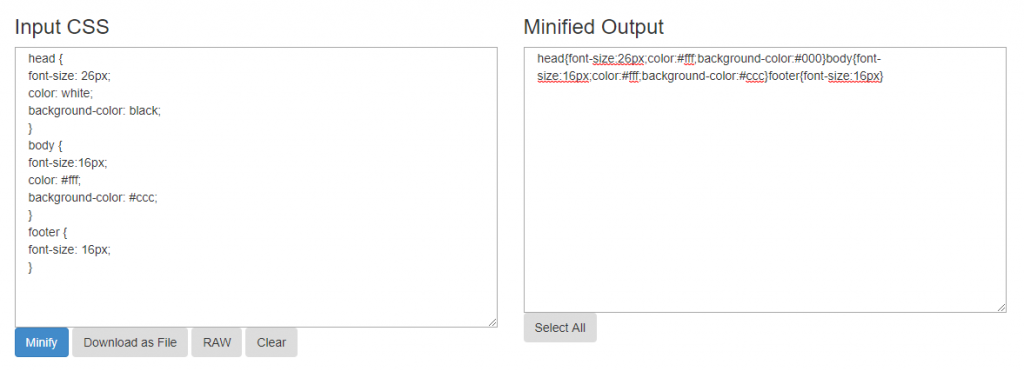
Minification is a process of making a file smaller by removing unnecessary information from it.
For example, when writing JavaScript and CSS, most, if not all coders, like to use spaces in order to keep their code clean and easy to read. However, those extra spaces add up, especially if you have a long piece of code.

cssminifier.com
Another way of minifying code would be by combining similar elements.
For example, if my head and footer sections were identical, instead of writing them like this:
body {
font-size: 16px;

}

footer {

font-size: 16px;

}
I could write:
body, footer {
font-size: 16px;

}
Compression is the process of shrinking files by replacing recurring sequences of information with a single reference to that particular sequence.
So, for example, if I have the following code: 123 4 123 123 123 4 123 123, I could replace 123 with a 1 and get a compressed version like this one: 1 4 1 1 1 4 1 1. Of course, it’s far more complex than what I’ve presented.
This generally happens on the server side and the most common one is called Gzip compression. The server sends a compressed version. After the browser receives the compressed file, it decompresses it by reversing the process, to read its actual contents.
This works pretty much like WinRAR; we probably all know it, because we’ve been using it for free since forever!
If you’re on a popular CMS, you will definitely find a plugin for both compression and minification. For example, the W3 Total Cache plugin does a lot of things including both of these, if you set it up properly.
Remember that compression is dependent on server setup. If your server does not support Gzip, you won’t be able to compress files. If you have an Apache server, make sure you have mod_deflate installed.
You can ask your server provider if your hosting supports it. 99.9% of the time they will say yes. If it’s not already installed, they should do it free of charge, as it’s something pretty basic.
If you’re not on a popular CMS you can also enable Gzip compression via the .htaccess file (Apache servers) by adding the following code, as long as mod_deflate is installed.
<span class="token operator"><</span>IfModule mod_deflate<span class="token punctuation">.</span>c<span class="token operator">></span>
<span class="token shell-comment comment"># Compress HTML, CSS, JavaScript, Text, XML and fonts</span>
AddOutputFilterByType <span class="token constant">DEFLATE</span> application<span class="token operator">/</span>javascript
AddOutputFilterByType <span class="token constant">DEFLATE</span> application<span class="token operator">/</span>rss<span class="token operator">+</span>xml
AddOutputFilterByType <span class="token constant">DEFLATE</span> application<span class="token operator">/</span>vnd<span class="token punctuation">.</span>ms<span class="token operator">-</span>fontobject
AddOutputFilterByType <span class="token constant">DEFLATE</span> application<span class="token operator">/</span>x<span class="token operator">-</span>font
AddOutputFilterByType <span class="token constant">DEFLATE</span> application<span class="token operator">/</span>x<span class="token operator">-</span>font<span class="token operator">-</span>opentype
AddOutputFilterByType <span class="token constant">DEFLATE</span> application<span class="token operator">/</span>x<span class="token operator">-</span>font<span class="token operator">-</span>otf
AddOutputFilterByType <span class="token constant">DEFLATE</span> application<span class="token operator">/</span>x<span class="token operator">-</span>font<span class="token operator">-</span>truetype
AddOutputFilterByType <span class="token constant">DEFLATE</span> application<span class="token operator">/</span>x<span class="token operator">-</span>font<span class="token operator">-</span>ttf
AddOutputFilterByType <span class="token constant">DEFLATE</span> application<span class="token operator">/</span>x<span class="token operator">-</span>javascript
AddOutputFilterByType <span class="token constant">DEFLATE</span> application<span class="token operator">/</span>xhtml<span class="token operator">+</span>xml
AddOutputFilterByType <span class="token constant">DEFLATE</span> application<span class="token operator">/</span>xml
AddOutputFilterByType <span class="token constant">DEFLATE</span> font<span class="token operator">/</span>opentype
AddOutputFilterByType <span class="token constant">DEFLATE</span> font<span class="token operator">/</span>otf
AddOutputFilterByType <span class="token constant">DEFLATE</span> font<span class="token operator">/</span>ttf
AddOutputFilterByType <span class="token constant">DEFLATE</span> image<span class="token operator">/</span>svg<span class="token operator">+</span>xml
AddOutputFilterByType <span class="token constant">DEFLATE</span> image<span class="token operator">/</span>x<span class="token operator">-</span>icon
AddOutputFilterByType <span class="token constant">DEFLATE</span> text<span class="token operator">/</span>css
AddOutputFilterByType <span class="token constant">DEFLATE</span> text<span class="token operator">/</span>html
AddOutputFilterByType <span class="token constant">DEFLATE</span> text<span class="token operator">/</span>javascript
AddOutputFilterByType <span class="token constant">DEFLATE</span> text<span class="token operator">/</span>plain
AddOutputFilterByType <span class="token constant">DEFLATE</span> text<span class="token operator">/</span>xml
<span class="token shell-comment comment"># Remove browser bugs (only needed for really old browsers)</span>
BrowserMatch <span class="token operator">^</span>Mozilla<span class="token operator">/</span><span class="token number">4</span> gzip<span class="token operator">-</span>only<span class="token operator">-</span>text<span class="token operator">/</span>html
BrowserMatch <span class="token operator">^</span>Mozilla<span class="token operator">/</span><span class="token number">4</span>\<span class="token punctuation">.</span><span class="token number">0</span><span class="token punctuation">[</span><span class="token number">678</span><span class="token punctuation">]</span> no<span class="token operator">-</span>gzip
BrowserMatch \<span class="token package">bMSIE</span> <span class="token operator">!</span>no<span class="token operator">-</span>gzip <span class="token operator">!</span>gzip<span class="token operator">-</span>only<span class="token operator">-</span>text<span class="token operator">/</span>html
Header append Vary User<span class="token operator">-</span>Agent
<span class="token operator"><</span><span class="token operator">/</span>IfModule<span class="token operator">></span>
Sometimes, you can also combine the scripts. There are plugins that do this, such as Autoptimize, which I’ve presented before. Combining scripts is exactly what it says. Instead of having two files, you combine them into one. This way there’s only one request made to the server, instead of multiple ones.
However, combining scripts can many times causes bugs, so make sure you back up everything before.
Cache Policy
Caching is the process of storing files in a client’s browser in order to be able to quickly access them at a later time.
For example, if a user comes to your website for the first time, your logo will have to be downloaded. However, if you have an effective caching policy, that file will be stored in the user’s browser. When the user accesses your site a second time, it won’t have to download that file again as it will be instantly loaded from their computer.
Dynamic Elements (short cache policy): Dynamic elements are elements on your website that change frequently. For example, you might keep adding new posts in a slider on the Homepage.
In this case, the HTML is the dynamic element, so set a short caching policy if this fits you. 30 minutes might be enough, just in case the user returns to that page in the same session.
In some cases, you might not want to cache those elements at all, if promptitude is what matters for your users, such as on news websites.
Static Resources (long cache policy): Static resources are files that rarely change. These are usually images and CSS or JS files, but they can also be audio files, video files, etc.
You can set a longer cache time for images and CSS files since you know you will not be changing them very frequently. You can even go up to one year, but 3 months is usually enough.
Third Party Tools: You don’t really have control over 3rd party tools, so if you feel like a tool that is hosted elsewhere makes your website run very slow, better find an alternative or give up on it.
A solution would be to host the files on your own server and cache them. However, this might not be very productive and it’s not recommended, as you’ll have to constantly update those files as soon as new versions come out, otherwise the tool or app won’t work properly.
Cache Plugins: There are a lot of plugins that will properly handle the cache protocols required for a good user experience. If you’re on WordPress, one of these plugins is W3 Total Cache. However, if you want to go for a better option, WP Rocket is also pretty popular, but it will set you back a couple hundred bucks.
Just search for cache plugin / extension / module + your platform on Google to find what you need. Look at the reviews to pick the best one.
.htaccess file cache: You can also set a cache control header from your .htaccess file on an Apache server, if you don’t run your website on a popular CMS.
There are multiple ways:
## EXPIRES CACHING ##

<IfModule mod_expires.c>

ExpiresActive On

ExpiresByType image/jpg "access 1 year"

ExpiresByType image/jpeg "access 1 year"

ExpiresByType image/gif "access 1 year"

ExpiresByType image/png "access 1 year"

ExpiresByType text/css "access 1 month"

ExpiresByType text/html "access 1 hour"

ExpiresByType application/pdf "access 1 month"

ExpiresByType text/x-javascript "access 1 month"

ExpiresByType application/x-shockwave-flash "access 1 month"

ExpiresByType image/x-icon "access 1 year"

ExpiresDefault "access 1 month"

</IfModule>

## EXPIRES CACHING ##
Or you can also use this code:
# One year for image files

<filesMatch ".(jpg|jpeg|png|gif|ico)$">

Header set Cache-Control "max-age=31536000, public"

</filesMatch>
# One month for css and js

<filesMatch ".(css|js)$">

Header set Cache-Control "max-age=2628000, public"

</filesMatch>
The numbers in the max-age attribute are in seconds, so 3600 would mean one hour, 86400 one day and so on.
Resetting the cache: When you make modifications to a web page, you want to reset the cache if an older version has been cached previously. However, you can only reset the cache on your server.
This means that users who have downloaded a previous version of a certain file will still load that old version from their computer when they access the website again. The file will be refreshed after the set amount of time in your caching policy or if the user manually resets their browser cache.
If you have a critical error in your web design or code, you can change the filename of your file. This way you can be sure that the cache for that particular file will be reset.
Sometimes, Chrome’s cache can be difficult to reset. Sometimes, routers and datacenters between the client and the server might also cache files so, if you don’t see the modifications, give it a couple of hours.
Lightweight Theme & Plugins
The more you load your website with plugins, the heavier it gets and the slower it runs.
A website’s theme is the biggest ‘plugin’ the site has. Most themes out there come with heavy 3rd party builders and huge libraries of plugins which all make the site run slower.

For example, slider plugins generally add the slider JS code to all pages, although it will probably be used only on the homepage or a landing page. That’s some heavy code to be loading on every page! Not to mention that nobody likes them and they lower the conversion rate.
So when you’re looking for a theme, try to find one without too much animations, sliders, functions and so on. If you look at the big websites you’ll see that, in general, they’re pretty simple.
A good theme which I recommend is GeneratePress. It’s lightweight and will load very fast. You can enable or disable elements to keep your site as clean as possible.
Combining it with an optimization plugin such as WP Rocket (paid) or a combo of free plugins such as Autoptimize + Fastest Cache will make it blazing fast! You can also use W3 Total Cache, a plugin which does almost everything listed above pretty well.
When you install new plugins, think about how important they are to your website. After you install them, test your score and loading speed. Does the plugin make your site run slower? If yes, is it critical to keep the plugin? Maybe look for a better alternative or remove it completely.
How to Bulk Check the PageSpeed Insights Score
The annoying part about PageSpeed Insights is that it checks only one web page at a time. It would take an eternity to check all the pages on your website, depending on its size.
However, there’s a way of bulk checking the PageSpeed Insights Score. Have you guessed it yet?
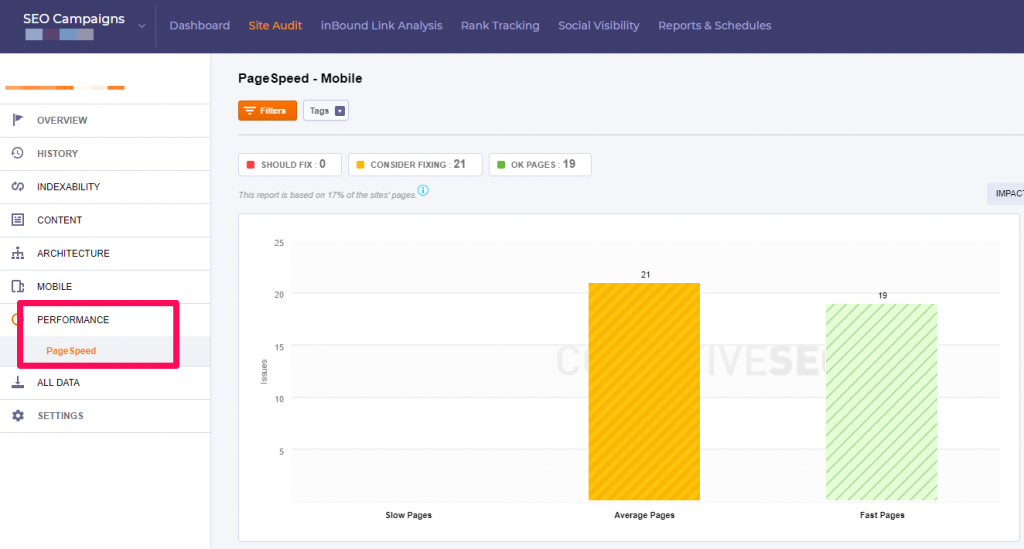
It’s the CognitiveSEO Tool Site Audit. Once you set up the technical SEO analysis with the Site Audit, go to your Campaign -> Site Audit -> Performance -> PageSpeed.

Of course, you can do a lot more with the tool, from improving your technical SEO and content to monitoring your rankings and link building efforts.
There’s also a somewhat free alternative which is a Chrome Extension. However, what it will actually do is ask for a list of URLs and then just open them as new tabs in the online PageSpeed Insights tool.

This means that the process is OK for about 10-20 tabs, if you have a medium to high end computer CPU. Anymore than that and the browser could crash or you’ll grow old waiting. It’s still pretty inconvenient.
Other SEO Tools for Measuring & Improving Site Speed
Of course, Google’s PageSpeed Insights tool isn’t the only tool to check and improve page speed. For once, we don’t really know where the tests are being performed from. If your site is hosted on a server in Europe and Google performs its tests from the US, it’s natural that the site will be slower.
However, there are tools which specify where the test is being performed from.
Pingdom
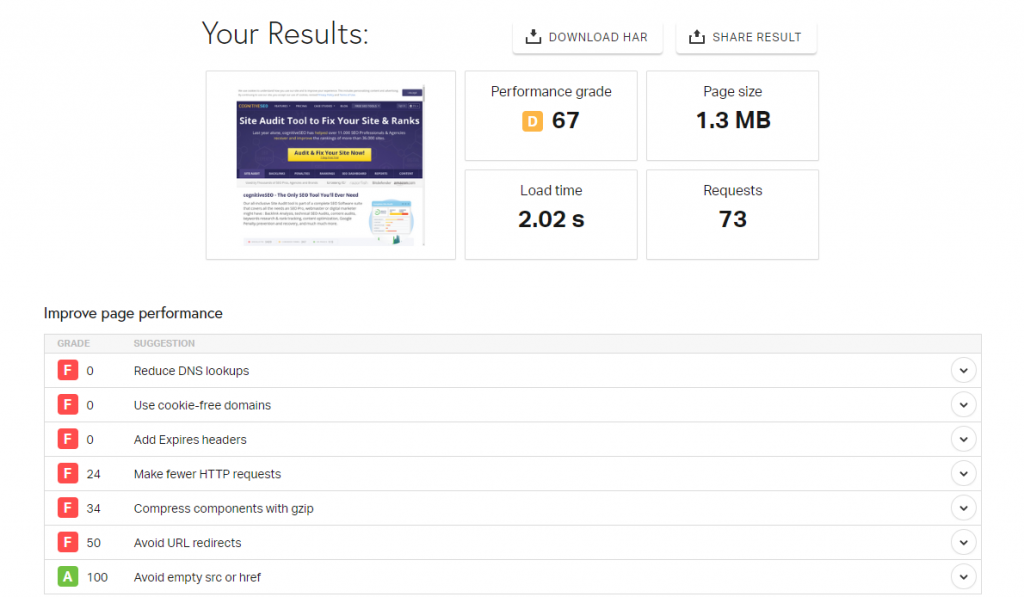
Pingdom Speed Test is a great tool which measures the speed at which your web page loads. Once the test is done, you’ll get some results which are similar to the ones on Google’s tool, at least visually.

What’s interesting about it is that you can select where the test is going to be performed from. Sure, the options are limited, but it’s still better than not even knowing it.
If you focus on local SEO, choose the location closest to your server. If you don’t know where it’s actually hosted, ask your hosting provider and you’ll find out.

It’s also a good idea to make multiple tests from different locations, just in case you have an international audience.
GT-Metrix
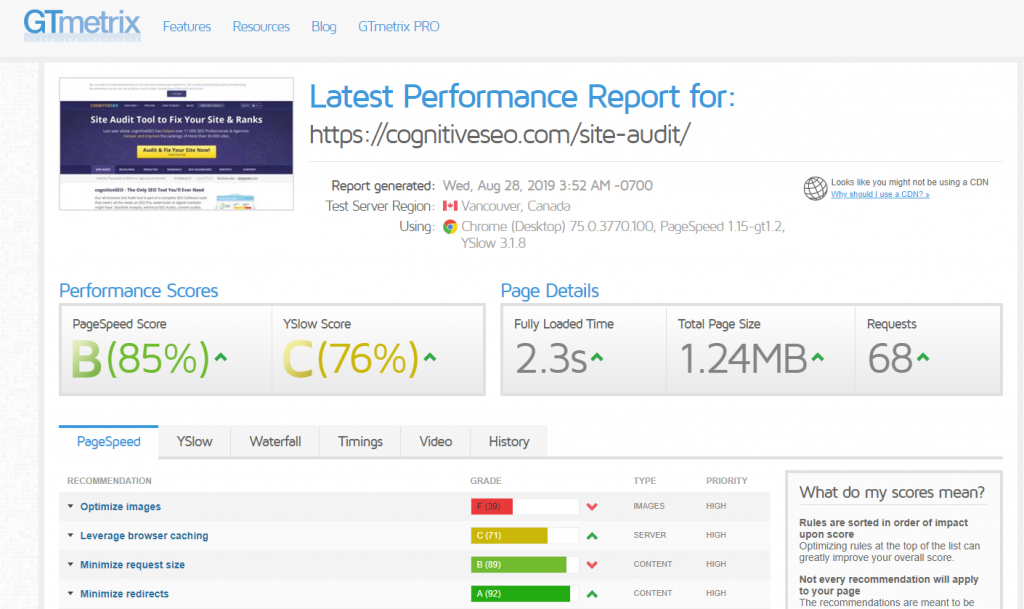
GT Metrix has been one of my favorite speed testing tools out there. Although it tests only from Vancouver, Canada, the insights it gives are very useful.

Quick tip: If you create a free account with them, you won’t have to wait so much for the test to be performed. To reduce load on their servers, they add you in a queue when there are too many requests. However, registered users have priority.
mod_pagespeed
The mod_pagespeed is a server addon from Google. Its purpose is to fix any page speed related issues at a core level, directly on the server side. This means that even if you add unoptimized images, mod_pagespeed will automatically compress, optimize and convert them to next gen image formats.
However, installing mod_pagespeed is definitely more technical than just dealing with everything in WordPress.
If your server already has it or you know what you’re doing go ahead and install it. However, it’s always a better idea to have a fast site in the first place instead of trying to cover things up.
Any way, this mod will increase load on your server as every time you upload an unoptimized image, it will have to use processing power to convert it.
Google AMP (Accelerated Mobile Pages)
If you want your site to be really fast on mobile searches, you can always implement Google AMP.
Google AMP or Accelerated Mobile Pages is a special type of HTML, stripped of heavy, slower loading elements.
More than that, AMP pages will preload in Chrome mobile browser as the user scrolls through the search results, resulting in an instant load of the page when the user taps the title.

There are also disadvantages, of course. You’re limited from every direction, although things are getting better and better every day. Also, your site’s design has to suffer and will pretty much look like any other site that uses AMP. Bummer.
The URL isn’t yours either, because Google loads a cached version of your site, on their URLs. However, Google developers have promised to bring native URLs into AMP.
On WordPress and other CMS, you can add AMP to your website through a plugin. For custom websites, you’ll need to get in touch with your developer and give them this link.
Conclusion
Improving your site speed is important for better search rankings. PageSpeed Insights provides a set of best practices and possible improvements, prioritized by their impact on your site’s speed.
While the score itself shouldn’t concern you too much, it’s a good idea to try and get it at least over 50. However, focus on load time, which is measured in seconds. A good website should load in about 3 seconds. A really, really fast one should load in about 1.
Having a good server, compressing images and keeping things clean and simple in your code will benefit you the most when it comes to website speed.
What’s your PageSpeed Insights Score? Have you seen better rankings after improving the loading speed of your website? Share your experience with us in the comments section below!
The post How Page Speed Affects SEO & Google Rankings | The 2019 Page Speed Guide appeared first on SEO Blog | cognitiveSEO Blog on SEO Tactics & Strategies.
How Page Speed Affects SEO & Google Rankings | The 2019 Page Speed Guide posted first on
http://nickpontemarketing.tumblr.com/
