As a team of marketing and developers, we like innovation and always thrive to offer the best user experience. We’re not just about creating new tools, but also improving and finding new ways to adapt to our users’ needs. We like to create solutions to address all the limitations of the existing toolset and fill in gaps.
Given the fact that Google Search Console, the tool that helps you measure your site’s Search traffic and performance, is such a used tool by our users, we had to include it within the cognitiveSEO Dashboard. No more switching between tools, no more wasting time and comparing data between tabs or downloaded files. Google Search Console is now part of the cognitiveSEO toolset.
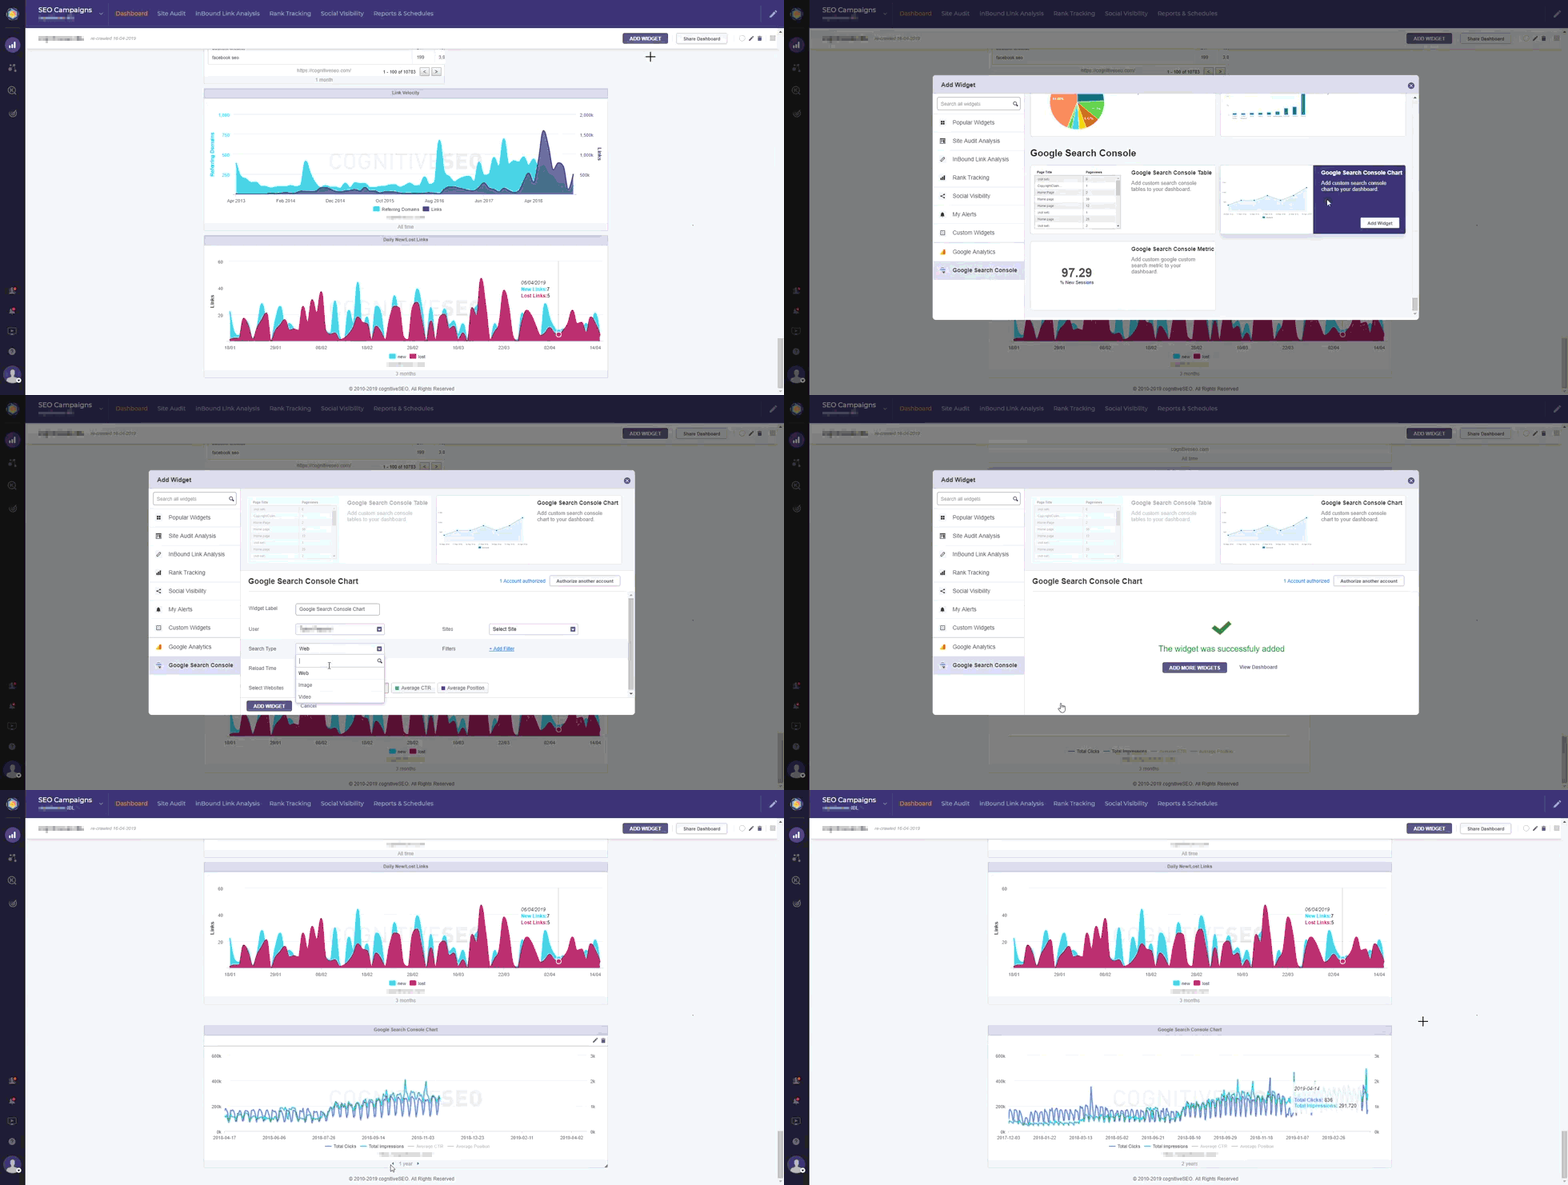
Therefore, from now on you’ll have all the marketing KPIs in one place. You have all the tools and information in a single window to create better reports and have a wider view of everything that happens with a website. After Google Analytics, is time for Google Search Console to join the cognitiveSEO family.
- The Importance of Google Search Console Integration
- Keep Track of Your Most Important Website Performance Metrics
- Combine Search Console Metrics and Analytics with the cognitiveSEO Data
- Get an Overview of Your Website’s Performance Including All the KPIs
- Personalize Your Reports Based on the Metrics that Interest You Most
1. The Importance of Google Search Console Integration
You can make better business decisions and improve your presence online following the data you get on your dashboard. Create correlations and cross-check your data through Google and cognitiveSEO. You can keep track of the most important Google Search Console data and, together with the Google Analytics integrations and the data you receive within cognitiveSEO, you can create one of the most comprehensive reports.
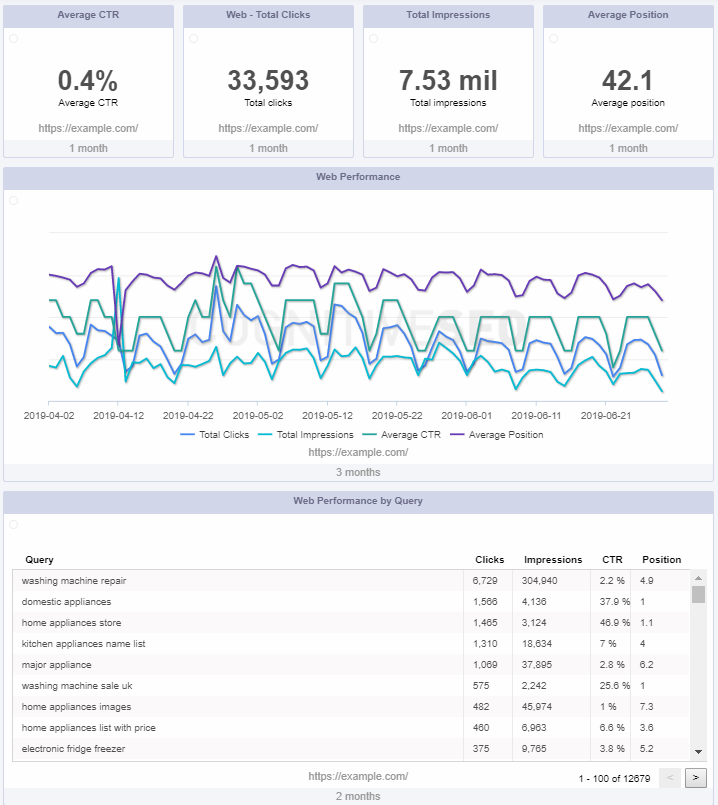
The information you get within cognitiveSEO is unique and helps you have an overview of your website from a different perspective. The result is simple: no more wasting time and a way better website management.
2. Keep Track of Your Most Important Website Performance Metrics
The new Google Search Console integration reunites all the important marketing KPIs in one place and keeps you updated of any change. Once you have authorized your Google Search Console account you’ll be able to track a lot of metrics in the cognitiveSEO Dashboard.
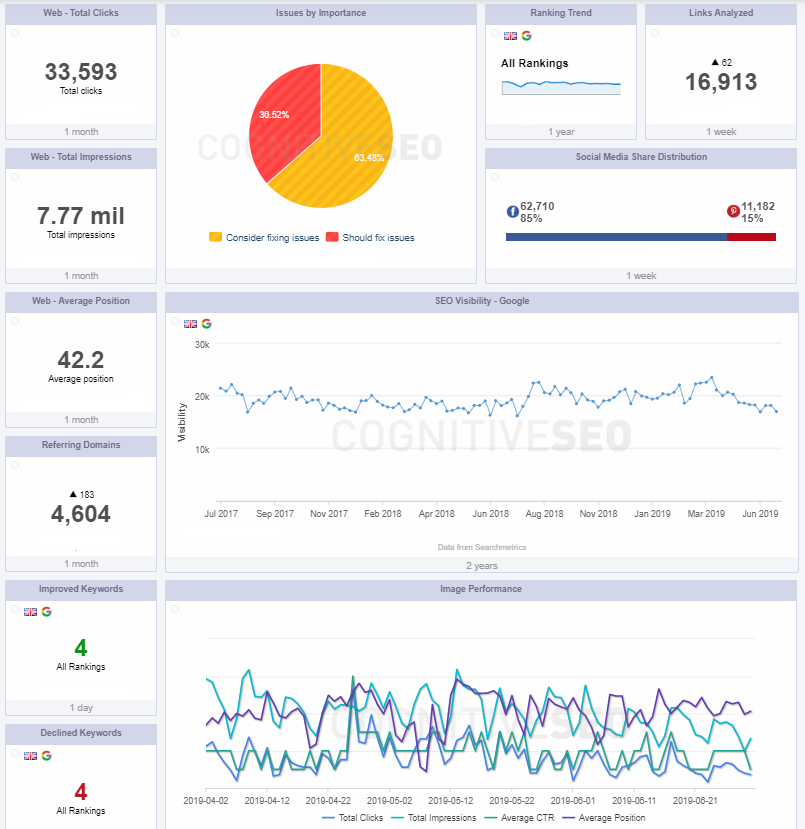
Form pie charts to tables, the most important data will be displayed directly in your cognitiveSEO account. You can make lots of combinations due to the high level of personalization given by the widgets. And basically, the same data you’re seeing within your Search Console account, can be seen directly within cognitiveSEO. Pretty neat, right?
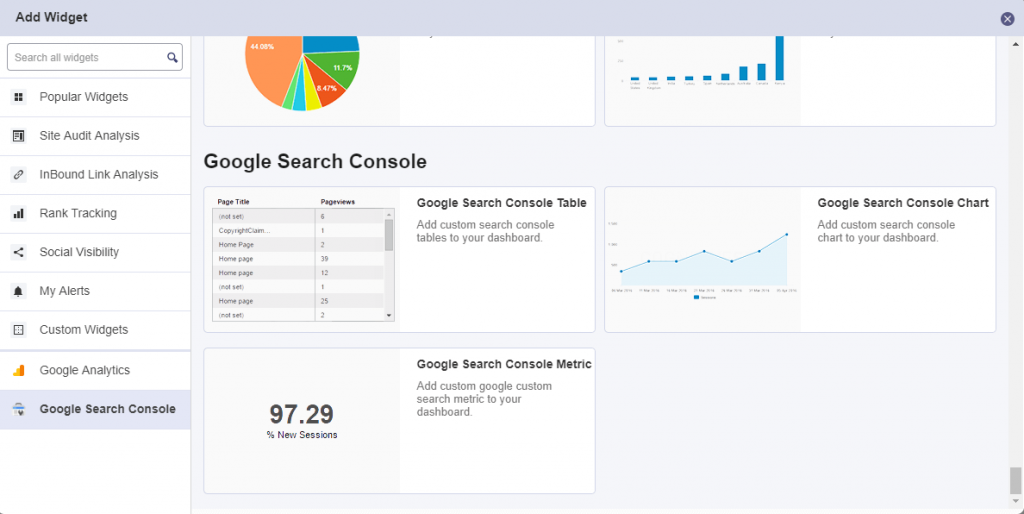
Almost all the data that you can see within the Search Console can be added on the cognitiveSEO dashboard. Yet, for a better understanding, let’s browse through some metrics from Search Console and see how we can monitor them within our SEO toolset.
Overall Web, Image or Video Performance
You’ve probably heard time and time again that performance matters and that the first step in improving your website is measuring it.
But what web performance metrics should you pay attention to? Well, it depends. While there are some universal web performance metrics that almost everyone should track, the metrics that matter most to you could vary based on your industry or business goals. And this is why we want to offer you the possibility of adding as many metrics as possible from Page Speed, Google Analytics, Google Search Console.
Metrics are not one size fits all.
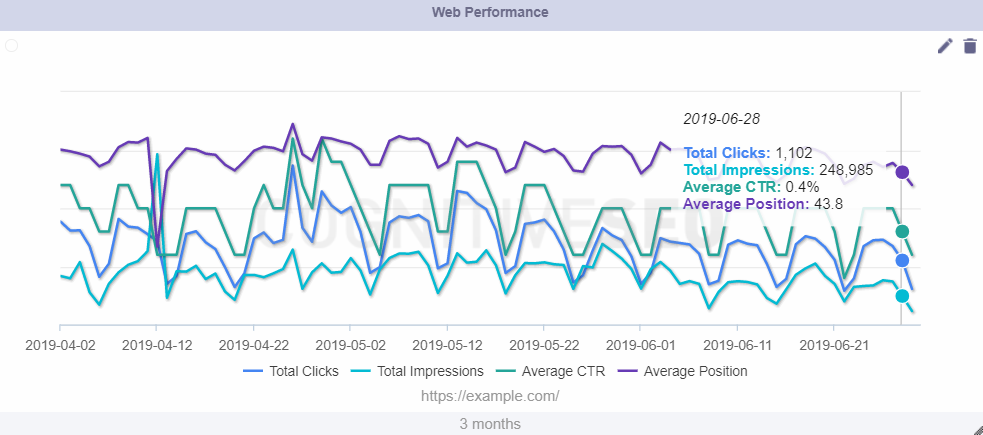
One of the most popular chart from Search Console, the performance one, can now be added within cognitiveSEO. You can see the velocity of your clicks, impressions, click-through- rate or average position at a web, image or video level. Of course, you can choose the period of time you want to see the data for, keeping in mind that this Google tool allows you to see data from the last 16 months.
Keep in mind that for a better analysis, the total number of clicks, impressions and average CTR, and position you have the possibility of adding two types of chart: a numeric one and a trend one.

But let’s take a look at these metrics a bit more granular.
Total Number of Clicks
Intuitively, the total number of clicks tracks the number of people that clicked on a page from your website in SERP. It basically counts how many people visit your website and it gives you indications of your website’s traffic. Therefore, you can view the evolution of your whole website’s clicks in the search results. This chart is customizable and allows you to select:
- the search type: web, image, video;
- reload time: 30 minutes, 1 hour, 2 hours;
- the period of time you want to see the data for.
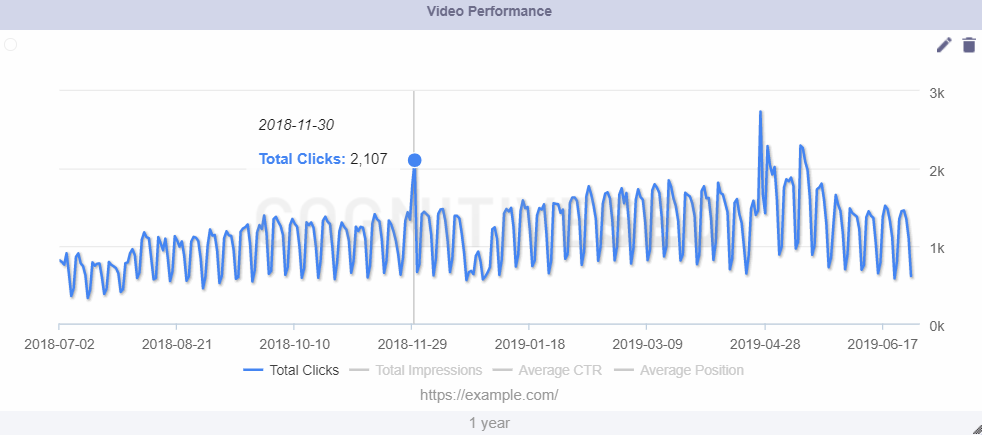
Of course, you can edit the chart any time you want and select the period for display, available at the bottom of the chart by clicking on the left and right arrow. There are lots of periods available; it can be 1 week, 2 weeks, 1 month, 1 year, and more, up to all the time.
Total Number of Impressions
The total impression chart is a very intuitive one: it keeps track of the amount of time a user sees your page in Google Search results. Similar to clicks, impressions measure one thing: the effectiveness of your website content. An impression is a view. When a page of your website displays to a user in the search results, after a keyword search, that is one impression. The impressions are counted every time a person sees your webpage, no matter if it’s the first or the tenth time visitor sees it.
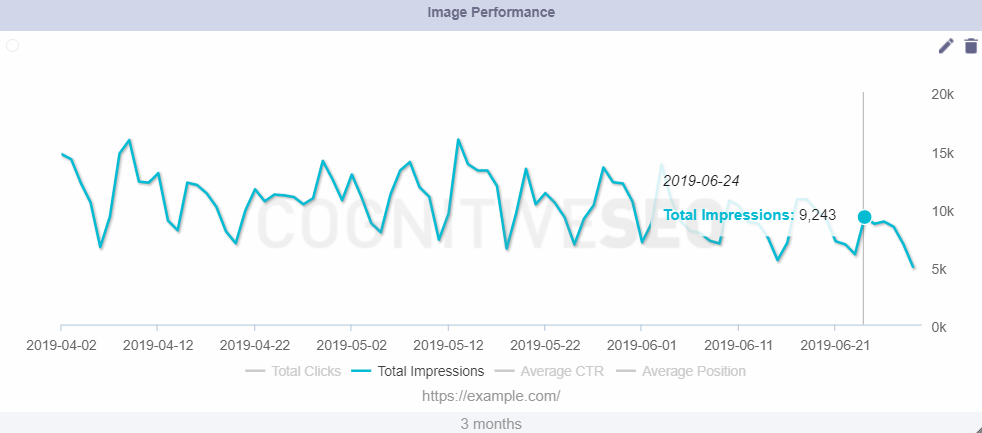
The chart can be customized for a specific period to display the trending line, the reload time and search type. All of these can be added or adjusted within our freshly added Google Search Console widgets.
Average CTR (Click-Through Rate)
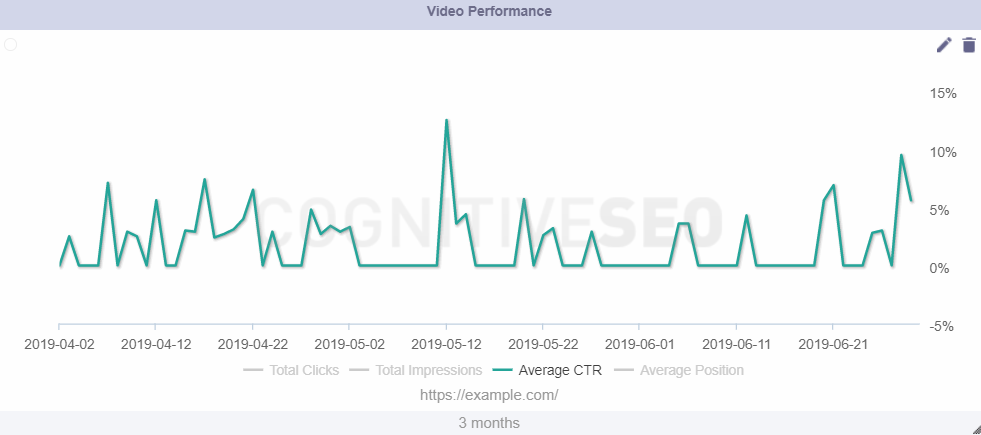
The average click-through rate reveals how often people who view your page in the search results click on it and visit your website. The CTR determines somehow the value of your webpage. The higher your CTR, the better. Continually keeping an eye on this metric is highly important as it helps you draw some important conclusions on your business performance: what it works, why it works, what you need to improve, etc.
But click-through rate and rankings – do they go hand in hand or not? You can check out if and how click-through rate impacts your Google rankings from this awesome SEO interview.
Web Performance by Page and Device
You know the saying: all pages are equal, but some of them are more equal than others. Get to know how your pages are performing; which one has the most clicks, impressions? Which one has the least? Which one should you focus on less and which one is bringing you most of the traffic?
Also, another important metric you should focus on is how your website is performing on several devices. Everybody knows mobile is on the rise but does this apply for your business as well? Check where most of your clicks, and therefore your users, are coming from and start re-thinking your strategy having this data in mind.
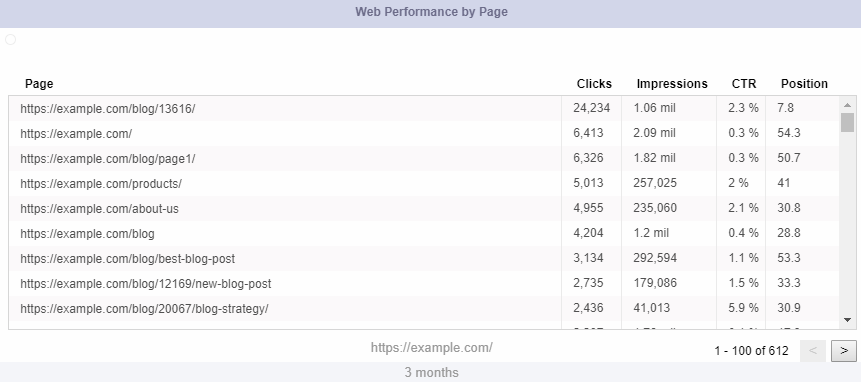
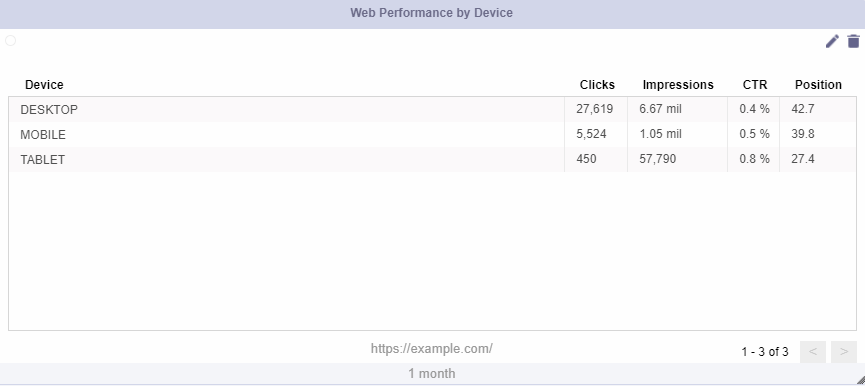
3. Combine the Search Console and Analytics Metrics with the cognitiveSEO Data
Being able to see data from multiple other tools directly within cognitiveSEO is awesome; yet, the question remains: how to make the most out of the Google Analytics and Search Console integration and get the best of both worlds?
There are several instances where you can combine the data from all the tools, but allow us to present just some of the instances where you can take advantage of both cognitiveSEO and the data provided by Google.
Get to Know Your SERP Position in Google
Google’s tool offers you the possibility to check your website’s average position. This chart helps you track the evolution of the average position in SERP for the whole website. You need to know that the data is aggregated by all queries. The position value is the average position for all searches. Yet, for your specific search, your position might be different than the average because of many variables, such as your search history, location, and so on.
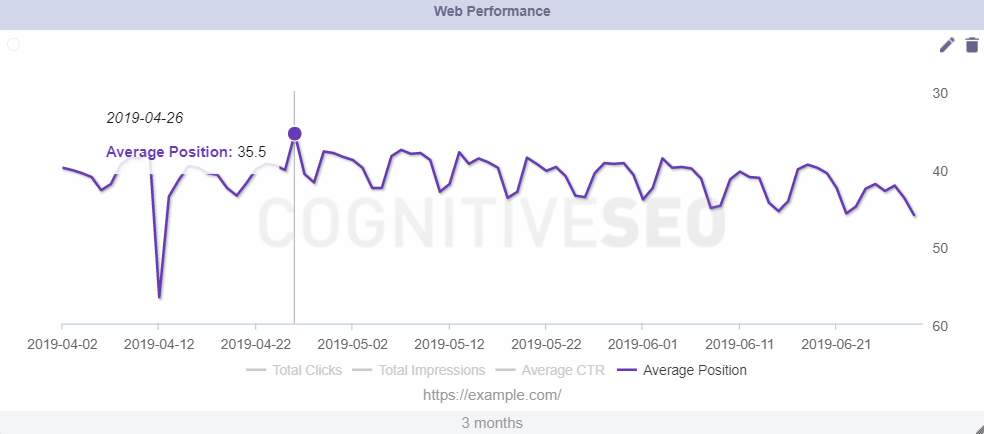
While knowing your average position can give you an overall idea of how your website is performing, knowing the exact positions your website is ranking for, on local, desktop or mobile, on the keywords you are interested in, it’s crucial.
We recommend you combine the data you get from the Search Console with the exact SERP positions you get from the cognitiveSEO Rank Tracker.
![]()
Hope you all know that within cognitiveSEO you can also track your rankings on a local level. With 46% of all searches on Google seeking for local information, there is no need to highlight the importance of keeping track of your ranks at a local level.
Pull data from Search Console to check out your average position by country, analyze the countries you are already ranking in and the ones that you are not but you’re thinking of targeting, and after that make sure to track keywords at a local level with cognitiveSEO.

Optimize for Your Top Search Queries
Search queries are the words that people type into the search box and trigger a list of results. The Search Queries table keeps track of the queries that trigger your domain in SERP, so each time someone searches for specific words, the tool extracts the lists.
Looking at the search queries list, you can get insight into exactly how users are searching for your type of product or service and giving you an opportunity to refine your focus keyword list to reach a broader audience.
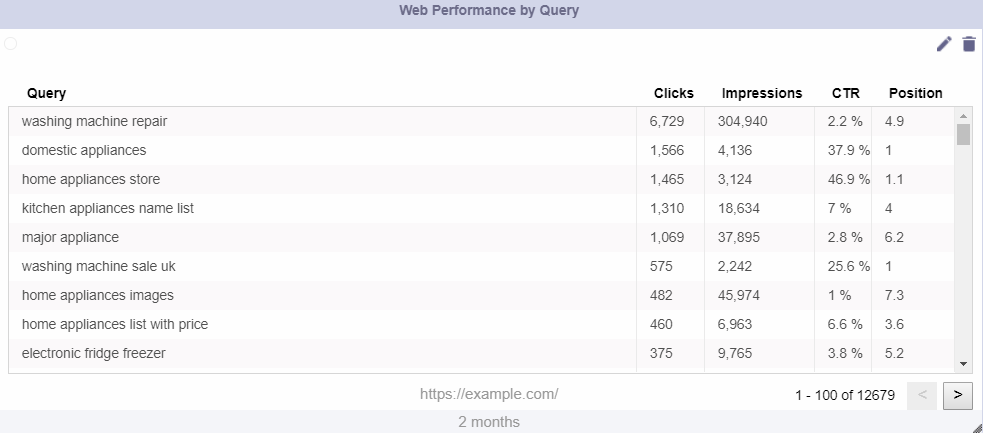
Once you know what keywords you want to target and how you are performing on those keywords, what you need to do know is to make sure that your site is well optimized for that keyword and has high chances of ranking for it.
You can use the Keyword Tool & Content Assistant to optimize your website for the exact keywords you want to rank and make sure you’ll reach to the top Google SERP.
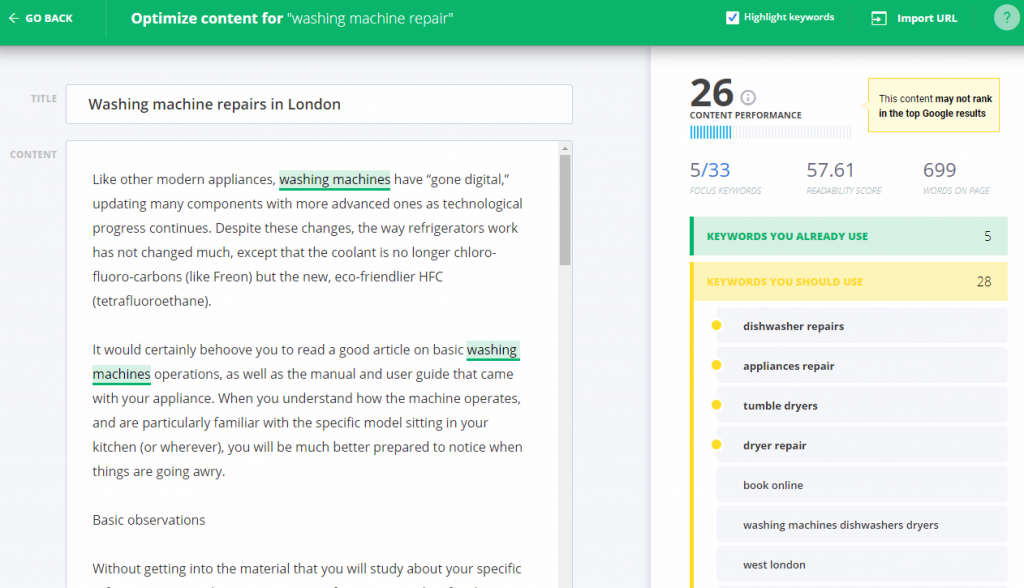
Once you optimize your pages, your job is not yet done. You need to constantly monitor your progress, check how your pages are performing and keep an eye on what it needs to be improved. The Google Analytics integration allows you to do exactly this: constant monitoring your website’s performance. And since it’s already integrated within the cognitiveSEO marketing dashboard, why not use it to its full capacities?

4. Get an Overview of Your Website’s Performance Including All the KPIs
Enabling Search Console data in your cognitiveSEO account is a time breaker and a game changer. Time is highly important and making apps more suited for the user is a great asset. We understand that value of time and cherish it. That’s why we thought of gathering all the important KPIs in one place. Moreover, lots of users mentioned the need in their reporting process.
Along with Google Analytics, the addition to the tool, Google Search Console integration, is an efficient solution that allows you to be in control of your website 24/7 without being overwhelmed by lots of cross-checking platforms, windows, and files.
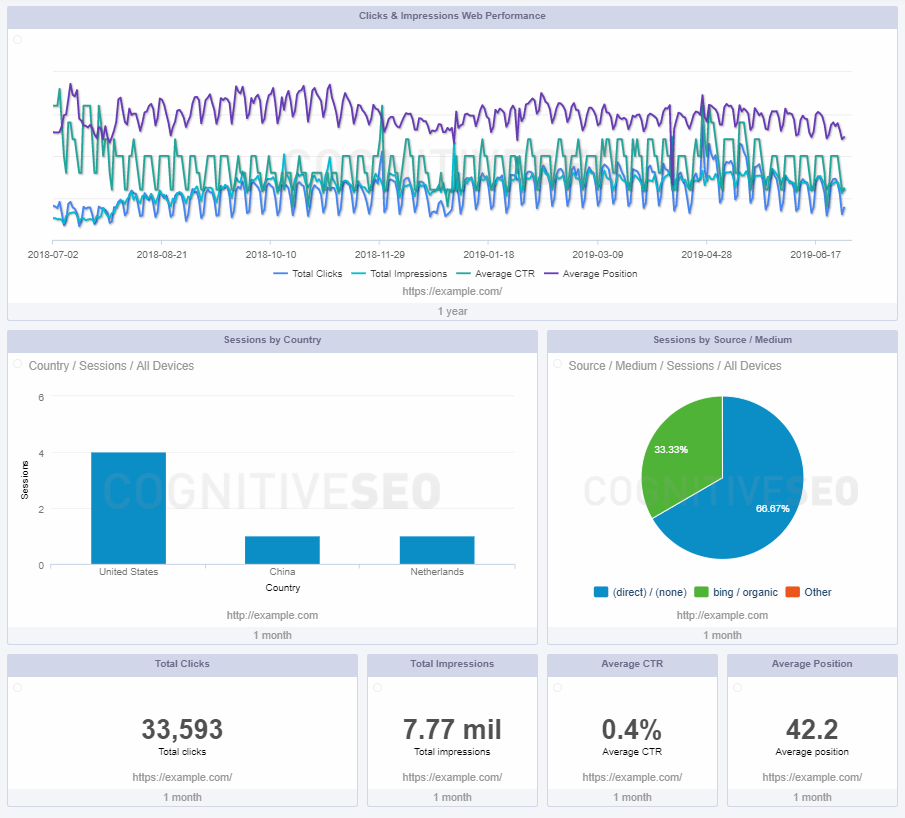
Probably, you are already familiar with the cognitiveSEO Dashboard; now, you can find the new Google Search Console widgets right below Google Analytics. Therefore the Dashboard will look more complete and more appealing for your reports and your day to day overview.
5. Personalize Your Reports Based on the Metrics that Interest You Most
I bet you put a lot of work in your reports. You can create more comprehensive reports that are visually appealing, highly personalized and automated. And you want to deliver top-notch data and only the relevant information. Get rid of the clutter and personalize your widgets by selecting only the category you’re interested in and apply all the filters that you’d like.
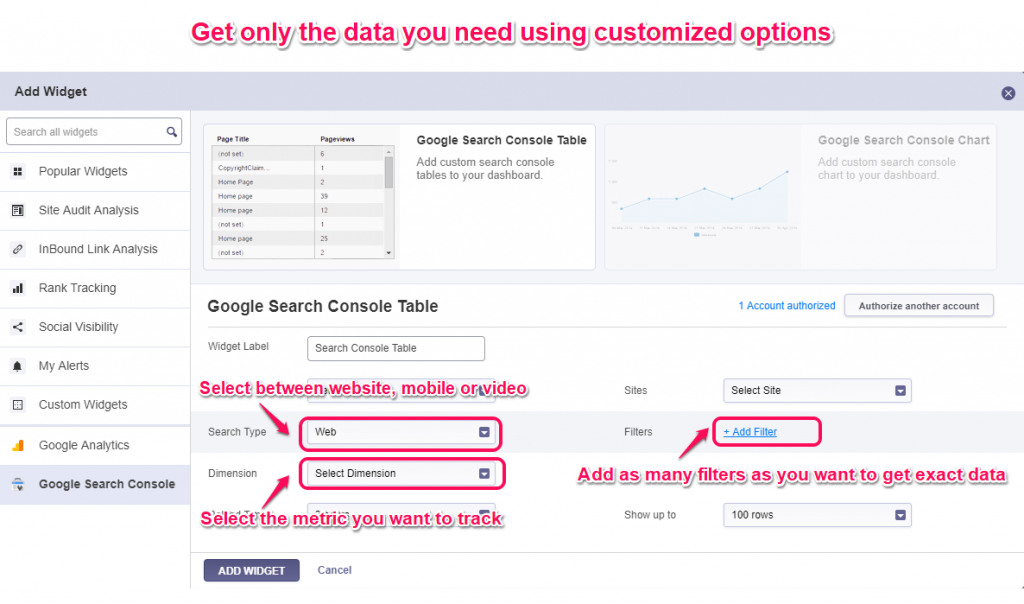
You decide what information to display, the period of time, the device tracked and a lot more. cognitiveSEO makes it very easy to set up each chart and view it the way you want. You can maximize or minimize your chart, exactly as you wish. All of these options are available in the GSC widget form cognitiveSEO Dashboard.
cognitiveSEO makes it very easy to have all the marketing KPIs in one place, by using the Google Analytics and Google Search Console integration. By authorizing the accounts you’ll get a lot of valuable data in a single place, creating the most comprehensive reports.
Now it is easier to create fully customizable reports to surprise your clients, to check all the results in a single place, save more time to do other tasks instead of wasting time on checking the data on multiple platforms, and easily share the report directly from the cognitiveSEO dashboard containing all the marketing assets to your clients and team members.
So, what you’re waiting for? Give this comprehensive SEO dashboard a free try!
The post All the Google Search Console & SEO KPIs in One Place: the cognitiveSEO Dashboard appeared first on SEO Blog | cognitiveSEO Blog on SEO Tactics & Strategies.
All the Google Search Console & SEO KPIs in One Place: the cognitiveSEO Dashboard posted first on http://nickpontemarketing.tumblr.com/

No comments:
Post a Comment